
If you have ever walked down Jaffa Road on a Friday afternoon and then walked down it again two hours after candle-lighting, you already know the punchline of this post. The city does not just slow on Shabbat — in observant neighbourhoods it more or less stops, and in a way that almost no other modern city does on any other day. What follows is an attempt to put a number on something I had only ever experienced as a sensation, and to do it in a way that lets the comparison against London and New York carry the weight of the claim. I have tried to keep the structure something like an experiment write-up, with hypothesis, methods, results, and discussion, while not losing the thread of why it is interesting in the first place.
Abstract
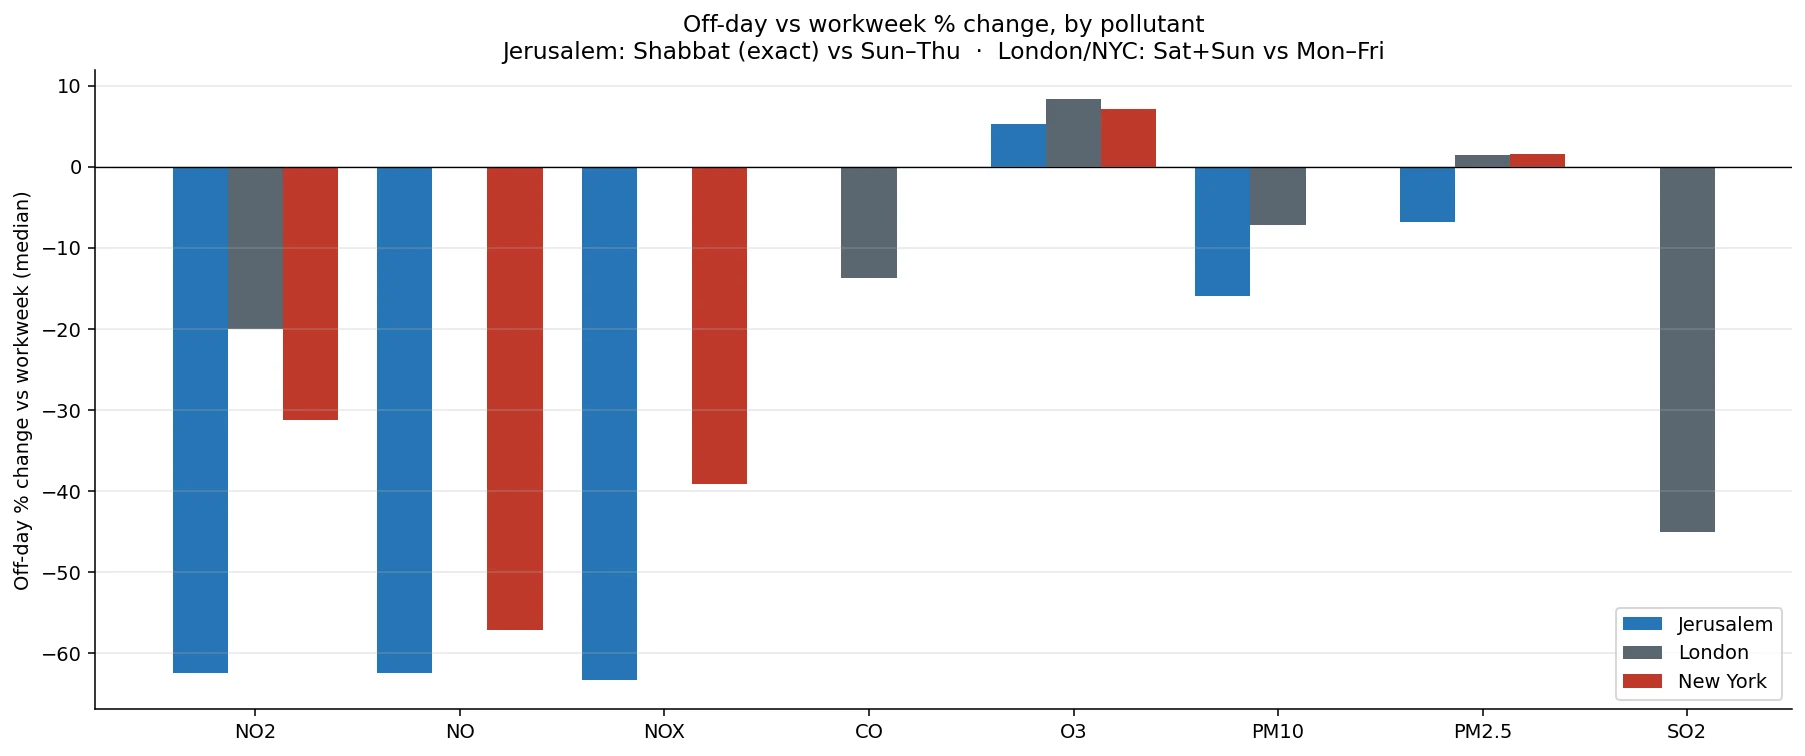
Across 12 months of hourly readings (28 April 2025 – 28 April 2026) from twelve Jerusalem monitoring stations, NO₂ on Shabbat — defined by exact halachic windows rather than calendar day — falls roughly 62% against a Sun–Thu daytime baseline. Equivalent off-day-vs-workweek drops are 31% in New York and 20% in London, both using Sat+Sun against Mon–Fri. The Jerusalem effect is approximately twice the New York weekend effect and three times the London weekend effect, and is concentrated almost entirely on a single day. The same direction holds for NO and NOx; ozone moves slightly upwards on off-days everywhere; PM2.5 shows no consistent Shabbat signal, supporting the interpretation that local-traffic NOx and regional-transport PM2.5 have largely independent source profiles.
Hypothesis
Jerusalem has an unusually strong weekly traffic cycle: many streets in Shabbat-observant neighbourhoods empty out between candle-lighting on Friday and tzeit hakochavim on Saturday. The same is true (more universally) on biblical chagim where driving is prohibited, and most starkly on Yom Kippur, when traffic effectively ceases nationwide — including among the non-observant. If anthropogenic emissions drive a meaningful fraction of urban air pollution, the halachic calendar should produce a periodic, predictable dip in traffic-derived pollutants (NO, NO₂, NOx). Comparing the magnitude of that dip against the milder weekend cycle in secular cities lets us isolate the "Shabbat-as-natural-experiment" effect from the generic "weekend dip" seen in any large city.
Methods
Data sources and coverage period
Jerusalem readings cover 28 April 2025 through 28 April 2026 at hourly cadence, sourced via the official data portal of Israel's Ministry of Environmental Protection (המשרד להגנת הסביבה). Twelve monitoring stations are used, geographically distributed across the municipality and including West Jerusalem residential, central commercial, and East Jerusalem stations (notably Rockefeller Museum, location 568). The pollutants used here are NO, NO₂, NOx, PM2.5, and O₃.
Control-city data covers the same 12-month window at the same hourly cadence, sourced from OpenAQ — three London stations (locations 148, 154, 155) and four New York stations (384, 626, 857, 1122). NO₂ values were converted from ppb (Israeli convention) to µg/m³ (OpenAQ convention) using 1 ppb ≈ 1.88 µg/m³ at 25 °C, 1 atm, so cross-city comparisons are like-for-like.
Halachic relabelling
The original dataset includes coarse calendar-based flags — is_friday, is_shabbat derived from day-of-week — but for this analysis those are superseded by exact halachic windows pulled from Hebcal using Jerusalem coordinates, a 40-minute candle-lighting offset, and tzeit hakochavim for end-of-Shabbat and end-of-chag. The relabelling step pairs candle-lighting events with their corresponding havdalah events, classifies each closed window by its memo (regular Shabbat vs Yom Tov vs Yom Kippur), and writes the labelled output as a parquet file. The 12-month window contains 50 Shabbatot, 9 Yom Tov windows, and 1 Yom Kippur.
Stratification
Every hourly reading is assigned to exactly one of six mutually-exclusive segments:
weekday— Sun–Thu daytime, excluding any halachic windowpre_shabbat— the 2 hours before candle-lighting (the erev-Shabbat shopping rush)shabbat— candle-lighting → havdalah, weekly Shabbatot onlypost_havdalah— the 2 hours after havdalah (the post-Shabbat rebound)yom_tov— biblical chagim with driving prohibition (excluding Yom Kippur, broken out separately)yom_kippur— exact YK window, kept separate as the cleanest natural experiment in the year
Chol HaMoed is intentionally not flagged — driving is permitted on those days, so they are indistinguishable from weekdays for the traffic hypothesis. London and New York use their own conventional segmentation: Mon–Fri as workweek, Sat+Sun as off-days. Because the secular weekly cycle is a different rhythm to Jerusalem's, this asymmetry is deliberate — the comparable quantity is "% drop from each city's own working week", not raw concentration.
Analysis
Headline percentages are the median across stations of each station's median segment value, normalised against its own weekday baseline — so each station contributes equally regardless of its absolute pollution level. No meteorological residualisation is applied at this stage; that is flagged as a limitation below. Code is in pure pandas/numpy/matplotlib (no statsmodels, no seaborn) and the figures are deterministic from the relabelled parquet.
Results
Result 1 — the headline ratio
Every modern city has a weekend dip in traffic-derived pollutants. London's NO₂ falls about 20% on Saturdays and Sundays against its Mon–Fri baseline; New York's falls about 31%. That is the natural variation any large city will show when its working population stops commuting. Jerusalem's Shabbat NO₂ falls 62%.
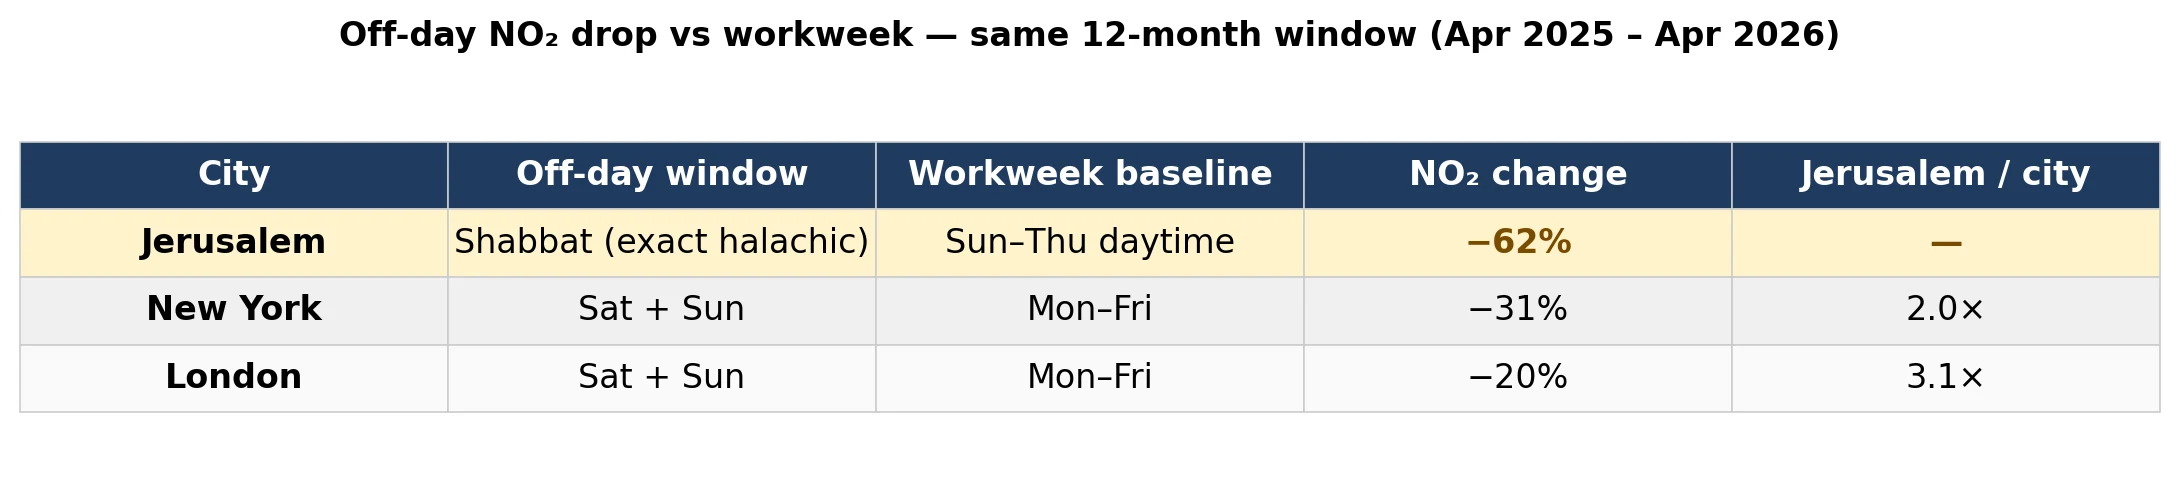
So Jerusalem's Shabbat dip is approximately 2× New York's weekend dip and 3× London's. The cleanest reading is additive: there is a generic "weekend effect" of roughly 20–31% that you would expect in any large Western city, and on top of that Jerusalem layers a specific "Shabbat effect" of approximately another 30 percentage points — the marginal contribution of a city where a critical mass of the population genuinely stops driving for ~25 hours, rather than just commuting less.
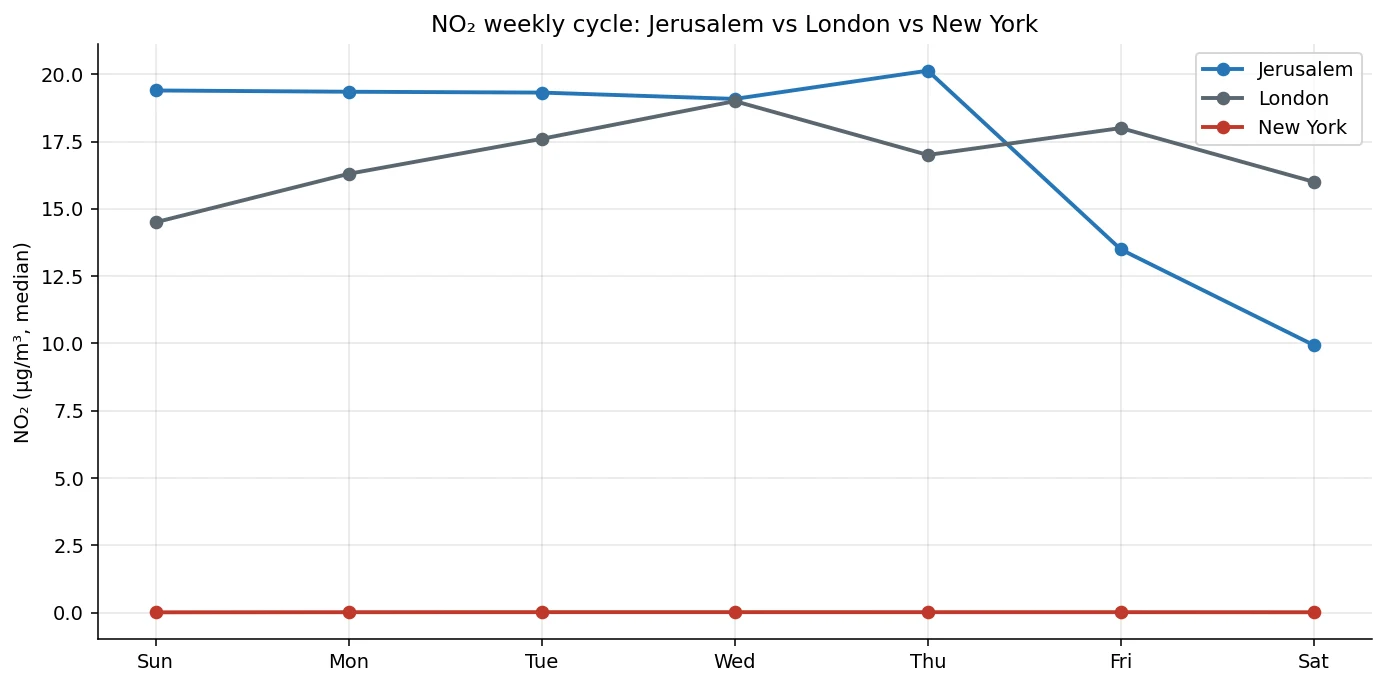
Result 2 — concentration on a single day
Overlaying day-of-week NO₂ curves shows the qualitative as well as quantitative difference. London and New York spread their dip across two days; Jerusalem concentrates almost the entire effect on Saturday. In pollution terms, Sunday in Israel is just another Tuesday — because Sunday is a working day. The effect is not just larger; it is more anatomically distinct.
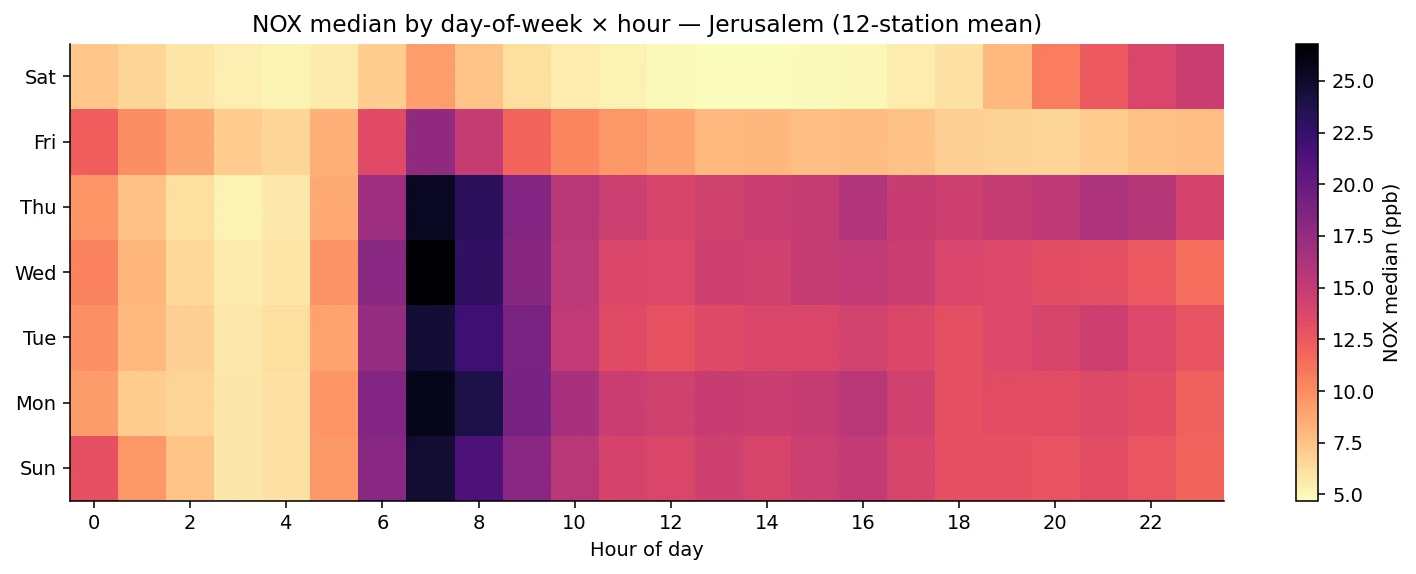
Plotting NOx as a heatmap of day-of-week against hour-of-day is even more direct. There is a column-shaped void where Saturday's daytime hours should be — a hole in the middle of the week. The image does not require any statistics to read.
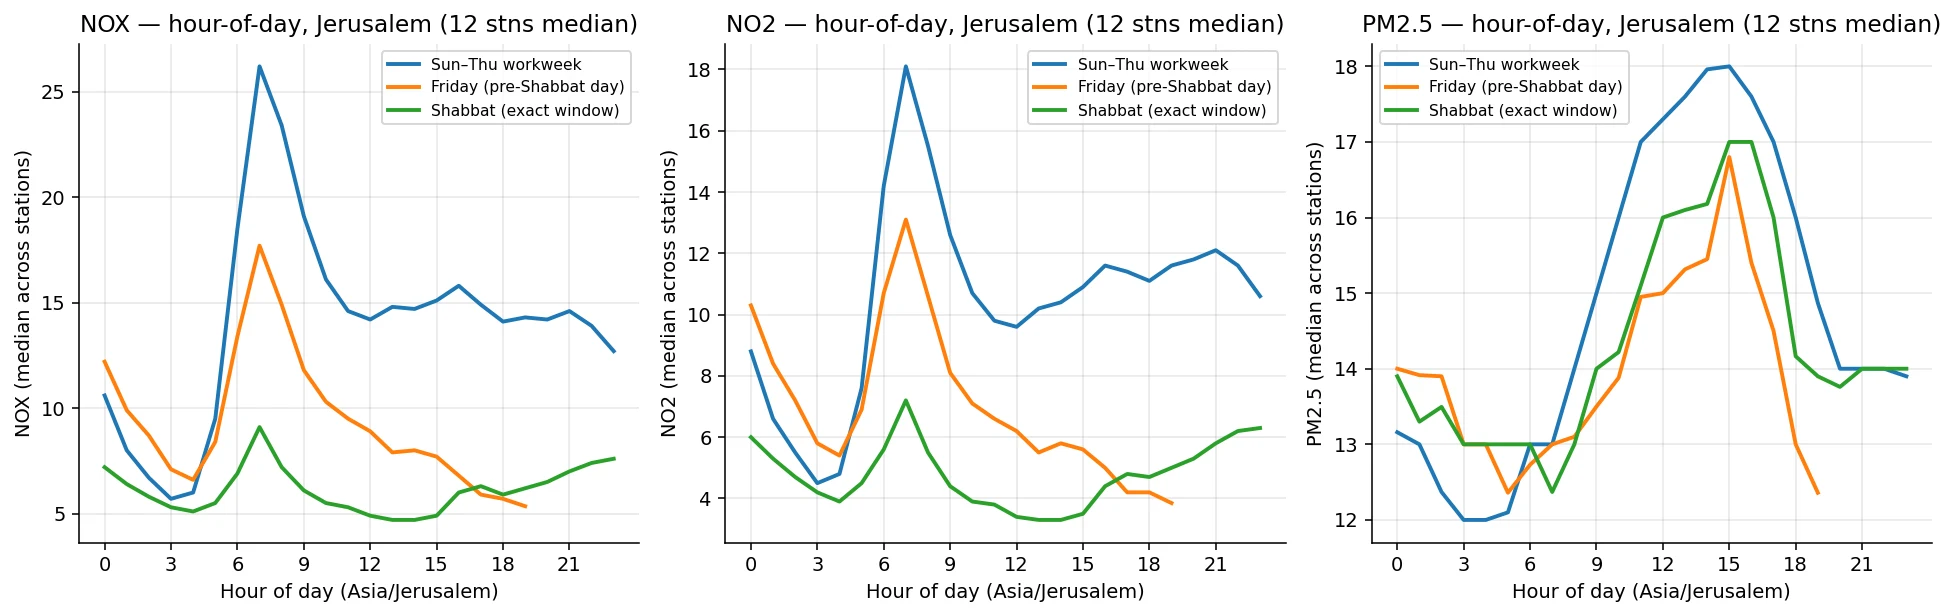
Result 3 — the transition aligns with candle-lighting
Once segments are in place, Friday's apparently "intermediate" pollution profile resolves into something more honest — a normal weekday morning followed by a sharp drop that lines up almost exactly with candle-lighting. This is the strongest internal evidence that the labels are doing real work; if Friday's signal were just generic pre-weekend behaviour, we would expect a smooth taper, not a hinge.
Result 4 — Yom Kippur as the cleanest natural experiment
If Shabbat is a partial empty-out — observant neighbourhoods quiet, secular ones less so, East Jerusalem more or less unchanged — Yom Kippur is the asymptote. Almost nobody drives. The roads close themselves without any state intervention. For about twenty-five hours, an entire country runs the kind of intervention experiment that environmental economists usually have to pay millions to simulate.
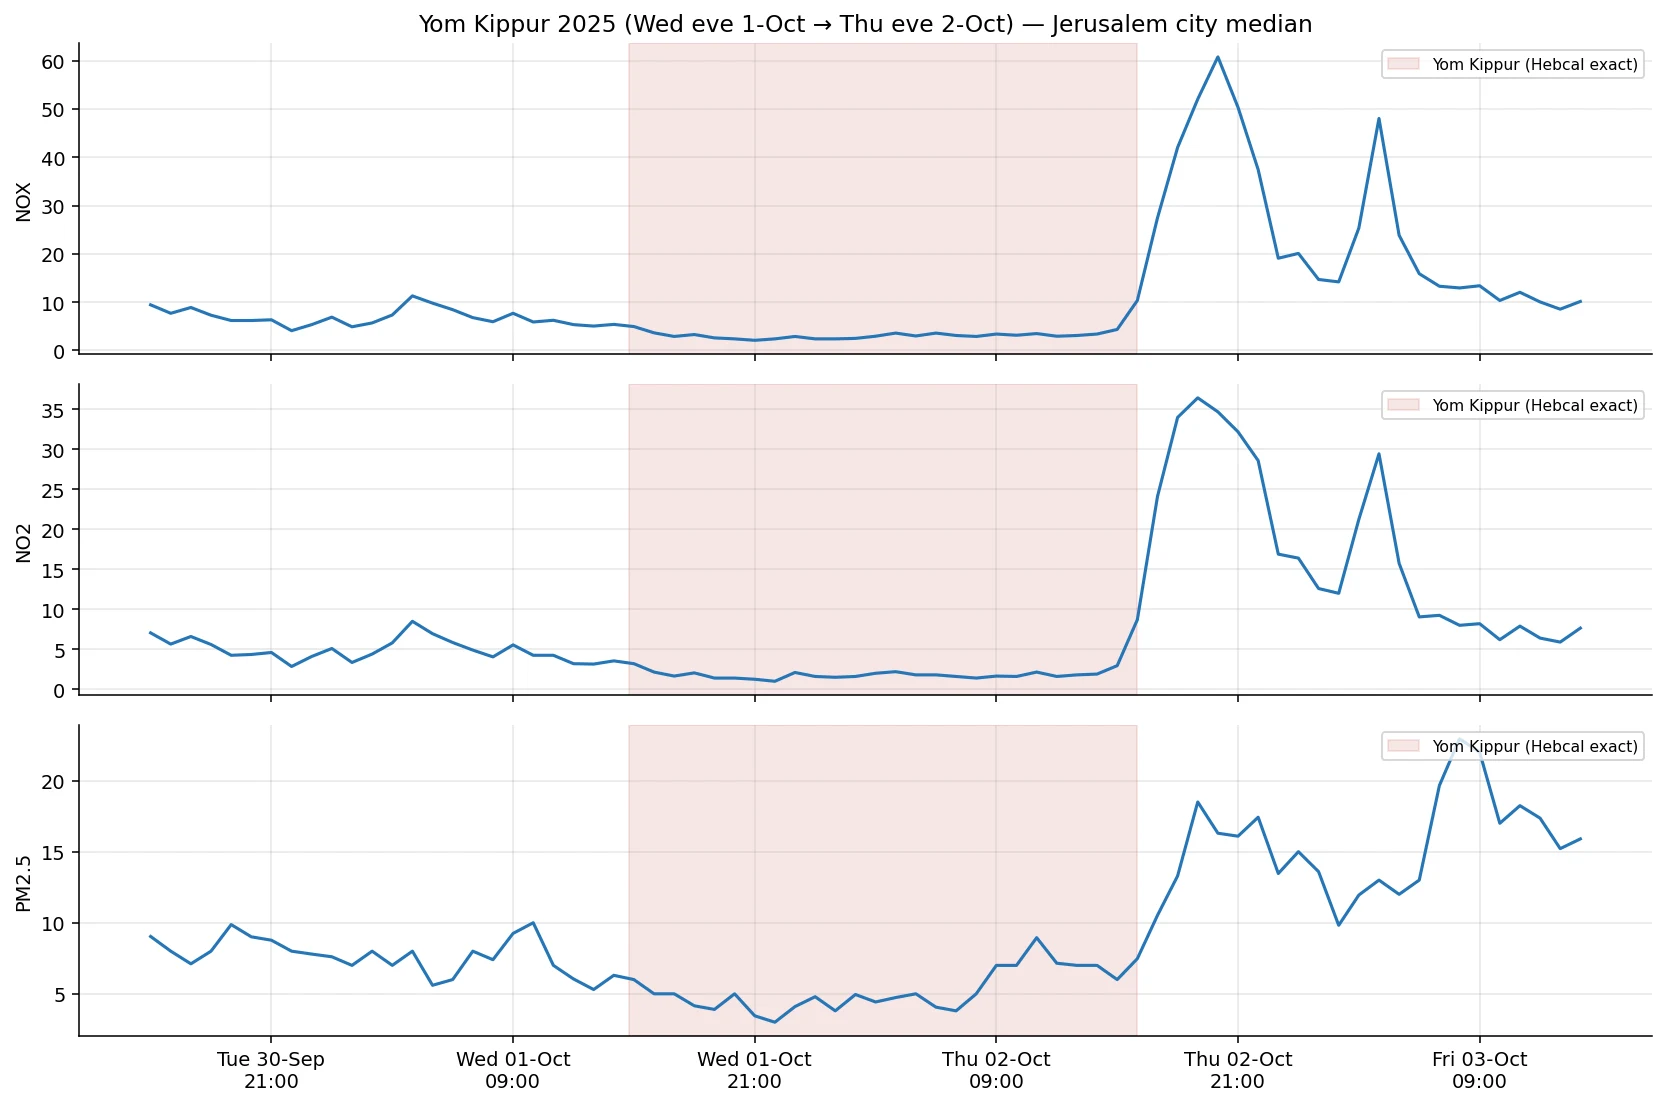
The 72-hour window bracketing Yom Kippur 2025 is the chart that most clearly looks like a switch being flipped. NOx and NO₂ collapse to near-baseline within an hour of onset, sit there for the duration of the fast, and bounce back the moment it ends. PM2.5 does not — which is itself the next result.
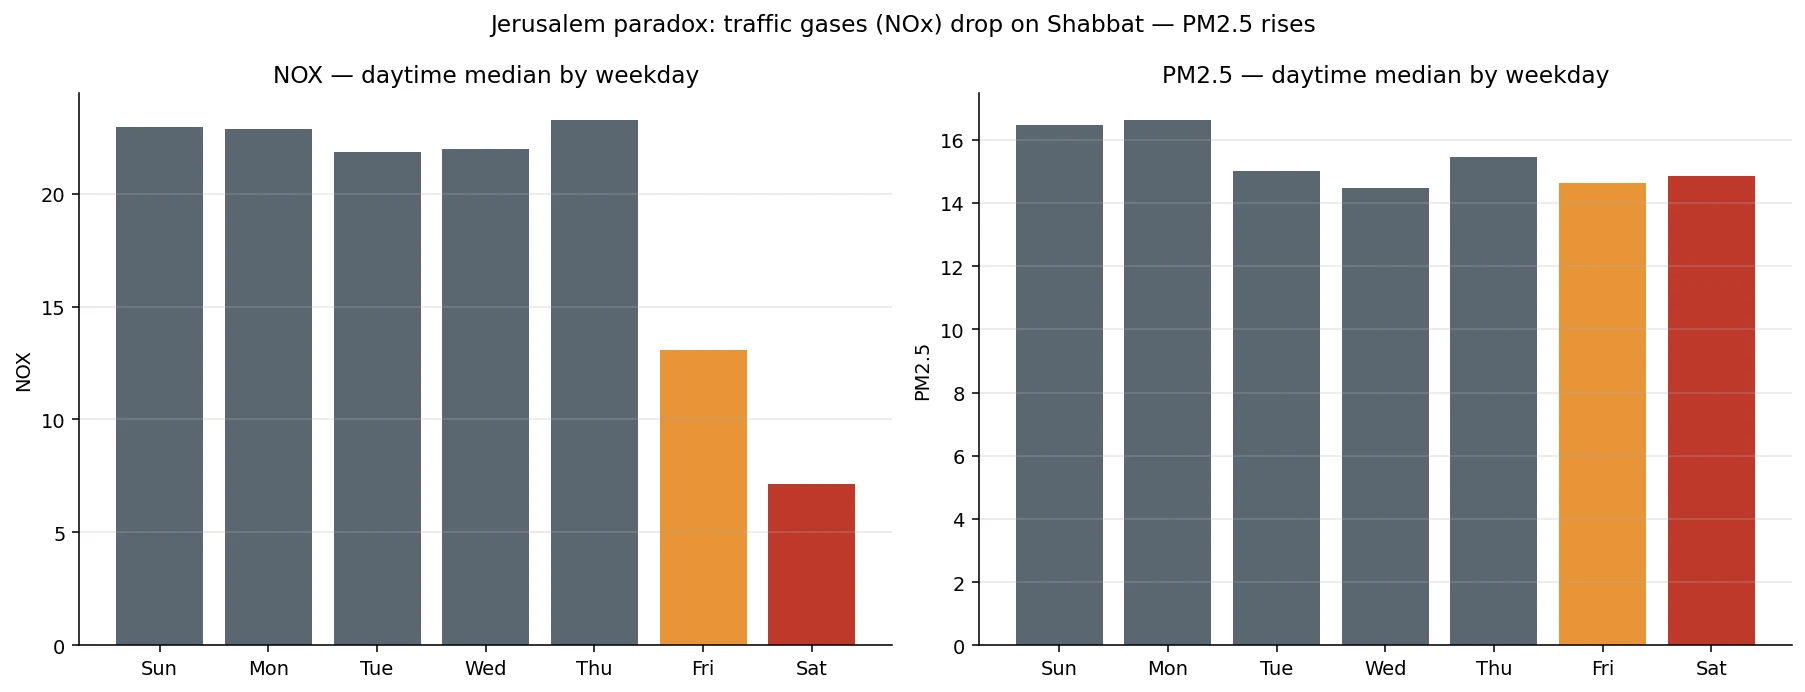
Result 5 — the PM2.5 paradox
If the Shabbat dip in NO₂ is a clean, almost theatrical signal, PM2.5 is its noisier, less cooperative sibling. On a calendar-day average, PM2.5 sometimes rises on Saturdays. Not because Shabbat magically generates particulates, but because PM2.5 in Jerusalem is dominated by sources that have nothing to do with the local working week — Saharan dust events, regional biomass burning, long-range transport. A handful of unlucky Saharan intrusions in spring 2026 fell on Saturdays, and on a 50-Shabbat sample that is enough to flip the sign.
Discussion
The contrast between Result 1 and Result 5 is the part of this analysis I think is most useful. The same observance that demonstrates how much of NO₂ is local and traffic-driven is also showing that PM2.5 is mostly not local and traffic-driven. Two pollutants that the public tends to lump under the single banner of "air pollution" turn out to have largely independent geographic origins, and the halachic calendar happens to be a remarkably good instrument for separating them.
The additive framing also matters for policy interpretation. If a city's weekend traffic dip is ~20–30% and its workweek pollution is what most residents experience, then "a Shabbat-style intervention" is not an additional 62% reduction on top of normal — it is the difference between the secular weekend baseline and the Jerusalem Shabbat baseline, which is more like an extra 30 percentage points. That number is closer to a real estimate of what genuinely-near-zero traffic looks like in this city, and it is corroborated by the Yom Kippur result.
Limitations
Twelve months is fifty Shabbatot, which is enough to find the signal but not enough to fully control for meteorology. A proper next pass would residualise against temperature, wind speed, boundary-layer height, and seasonality before treating the −62% number as final.
The pre-Shabbat and post-havdalah windows are heuristic two-hour blocks; the real rush-in and rush-out durations probably vary by neighbourhood and season.
East Jerusalem stations show the smallest Shabbat drop of any monitor in the network. This is consistent with the underlying hypothesis (the parts of the city that do not observe Shabbat keep their traffic) and functions as an internal control rather than a confound — but a station-level breakout would tighten the claim.
PM2.5 is reported here primarily as a null-result contrast against NOx; this analysis does not attempt to attribute the residual PM2.5 variation to specific source types.
Data and code availability
All analysis code, the labelled parquet, the cross-city CSV, and the figures (regenerable from the relabelled data with one script) are at github.com/danielrosehill/JLM-Air-Quality-Analysis. The underlying source dataset (Jerusalem hourly readings plus the Hebcal export and OpenAQ control data) is mirrored on Hugging Face at huggingface.co/datasets/danielrosehill/Jerusalem-Air-Quality-Shabbat and on Kaggle at kaggle.com/datasets/danielrosehill/jerusalem-air-quality-shabbat. Air-quality data is from the Israeli Ministry of Environmental Protection's official data portal (Jerusalem) and OpenAQ (London, New York). Halachic times are from Hebcal.
Halachic relabeling, cross-city control analysis, and validated findings for the Jerusalem-Air-Quality-Shabbat dataset
